
Page 54 - Raport_engleza_2019
P. 54
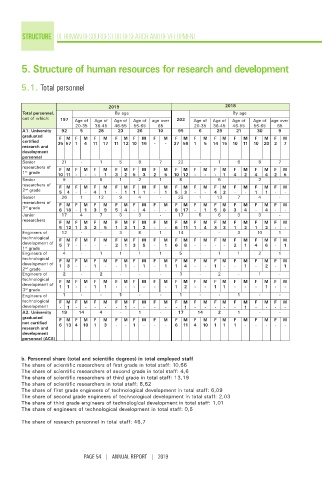
Structure    of human resources for research and development


        5. Structure of human resources for research and development


        5.1. Total personnel


                                      2019                                    2018
         Total personnel,               By age                                   By age
         out of which:  197  Age of   Age of   Age of  Age of  age over   202  Age of  Age of   Age of   Age of  age over
                           20‑35  36‑45  46‑55  56‑65  65           20‑35  36‑45  46‑55  56‑65  65
         A1. University   92  5    28     23    26     10     95     6     29     21     30      9
         graduated   F  M  F  M  F   M   F  M  F  M   F  M   F  M   F  M   F  M  F   M  F   M  F  M
         certified   35 57 1  4  11  17  11 12 10  16  -  -  37 58  1  5  14 15  10  11  10  20  2  7
         research and
         development
         personnel
         Senior       21     ‑     1      5      8      7     22      ‑     1      6      8      7
         researchers of   F  M  F  M  F  M  F  M  F  M  F  M  F  M  F  M   F  M  F   M  F   M  F  M
          st
         1  grade
                     10 11  -  -  -  1   3  2  5  3   2  5   10 12  -  -   -  1  4   2  4   4  2  5
         Senior        9     ‑     5      1      2      1      8      ‑     6      ‑      2      ‑
         researchers of   F  M  F  M  F  M  F  M  F  M  F  M  F  M  F  M   F  M  F   M  F   M  F  M
         2  grade
          nd
                     5  4  -  -  4   1   -  1  1  1   -  1   5  3   -  -   4  2  -   -  1   1  -   -
         Senior       26     1     12     9      4      ‑     25     1     13      7      4      ‑
         researchers of   F  M  F  M  F  M  F  M  F  M  F  M  F  M  F  M   F  M  F   M  F   M  F  M
         3  grade
          rd
                     8 18  -  1  3   9   5  4  -  4   -   -  8  17  -  1   5  8  3   4   -  4  -   -
         Junior       17     4     7      3      3      ‑     17     5      6      3      3      ‑
         researchers
                     F  M  F  M  F   M   F  M  F  M   F  M   F  M   F  M   F  M  F   M  F   M  F  M
                     5 12 1   3  2   5   1  2  1  2   -   -  6  11  1  4   3  3  1   2  1   2  -   -
         Engineers of   12   ‑     ‑      3      8      1     14      ‑     ‑      3     10      1
         technological   F  M  F  M  F  M  F  M  F  M  F  M  F  M   F  M   F  M  F   M  F   M  F  M
         development of   5  7  -  -  -  -  2  1  3  5  -  1  6  8  -  -   -  -  2   1  4   6  -  1
          st
         1  grade
         Engineers of   4    ‑     1      1      1      1      5      ‑     1      1      2      1
         technological   F  M  F  M  F  M  F  M  F  M  F  M  F  M   F  M   F  M  F   M  F   M  F  M
         development of   1  3  -  -  1  -  -  1  -  1  -  1  1  4  -  -   1  -  -   1   -  2  -  1
         2  grade
          nd
         Engineers of   2    -     2      -      -      -      3      ‑     2      ‑      1      ‑
         technological   F  M  F  M  F  M  F  M  F  M  F  M  F  M   F  M   F  M  F   M  F   M  F  M
         development of   1  1  -  -  1  1  -  -  -  -  -  -  1  2  -  -   1  1  -   -   -  1  -   -
          rd
         3  grade
         Engineers of   1    -     -      1      -      -      1      -     -      1      -      -
         technological   F  M  F  M  F  M  F  M  F  M  F  M  F  M   F  M   F  M  F   M  F   M  F  M
         development  -  1  -  -  -  -   -  1  -  -   -   -  -  1   -  -   -  -  -   1   -  -  -   -
         A2. University   19  14   4      -      1      -     17     14     2      1      -      -
         graduated   F  M  F  M  F   M   F  M  F  M   F  M   F  M   F  M   F  M  F   M  F   M  F  M
         not certified   6 13 4  10  1  3  -  -  1  -  -  -  6  11  4  10  1  1  1   -   -  -  -   -
         research and
         development
         personnel (ACS)
        b. Personnel share (total and scientific degrees) in total employed staff
        The share of scientific researchers of first grade in total staff: 10,66
        The share of scientific researchers of second grade in total staff: 4,6
        The share of scientific researchers of third grade in total staff: 13,19
        The share of scientific researchers in total staff: 8,62
        The share of first grade engineers of technological development in total staff: 6,09
        The share of second grade engineers of technological development in total staff: 2,03
        The share of third grade engineers of technological development in total staff: 1,01
        The share of engineers of technological development in total staff: 0,5

        The share of research personnel in total staff: 46,7


                              PAGE 54   |   ANNUAL REPORT   |   2019