

According to the activities proposed, two objectives were realized:
1.1. Manufacturing of model cables
1.2. Space charge and breakdown voltage measurements
The model cables were manufactured at IPROEB Bistrita and have the following characteristics:
a) Cooper conductor having the diameter = 1.1 mm;
b) Thermoplastic insulation having the following dimensions: thickness 0.8 mm, outer diameter of insulation = 2.7 mm;
c) Nominal voltage 450/750 V.
The space charge was experimentally determined at University of Montpellier 2 and the breakdown voltage at the Laboratory of Electro technical Materials, Electrical Engineering Faculty, UPB. The main conclusions are:
- The space charge is higher than zero, although the cables no suffered any degradation;
- The optimum value of the growth rate of breakdown voltage is 1 kV/s;
- The average value of the breakdown voltage 27.5 kV/mm is according to the theoretical one (25-30) kV/mm.
Activity 2.Space charge and breakdown voltage measurement Term: 6.12.2010 Responsible: Prof. Dr. Ing. Petru NOTINGHER (UPB) Maitre de conferences Petru NOTINGHER jr. (UM2)
Activity 3.Water trees development in minicables insulations Term: 6.12.2011 Responsible: Dr. Ing. Cristina STANCU (INCDIE ICPE CA)
According to the activities proposed, the following objectives were realized:
3.1. Water trees development in model cables insulations;
3.2. Space charge, ions penetration depth and breakdown voltage measurement on treed samples;
3.3. Electric field computation in samples with water trees and space charge.
Water trees in the model cables insulation at the frequencies 50 Hz, 2 and 3 kHz were developed so far. The ageing times are 24…1360 h (objective 2.1). The dimensions and water trees density, space charge density and the breakdown voltage were determined (objective 2.2). The results show an increase of the dimensions (length L and diameter D) , water trees density (ca) but also of the space charge density with the frequency and ageing time. On the other hand due to the increase of the ageing time and frequency of the electric field a decrease of the breakdown voltage can be seen.
Activity 4. Space charge, ions depth penetration and breakdown voltage on treed samples Term: 6.12.2011 Responsible: Dr. Ing. Cristina STANCU (INCDIE ICPE CA) Prof. Dr. Ing. Petru NOTINGHER (UPB) Maitre de conferences Petru NOTINGHER jr. (UM2)
Activity 5. Electric field computation in samples with water trees and space charge Term: 6.12.2011 Responsible: Dr. Ing. Cristina STANCU (INCDIE ICPE CA)
Computations were done for unaged and electrically aged samples in the presence of water trees and space charge. Three regimes of the electric field were considered: electrostatic, electrokinetic stationary and electrokinetic cuasistationary. According to the previous results (activities 3 and 4), where the water trees length and space charge density decrease in time, the electrokinetic cuasistationary regime of the electric field was considered (Figure 4). A local increase of the electric field at the tip of the water trees and i the vicinity of the conductor is presented. This increase leads to the partial discharge and electrical trees inception and, finally, to the breakdown of the insulation at lower voltages.
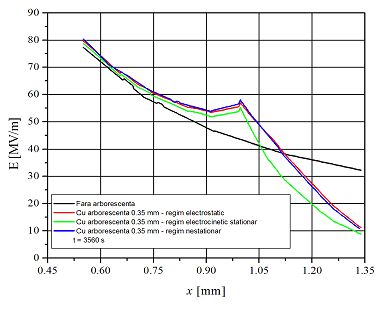
Figure 4. Electric field repartition in cable insulation with water trees.
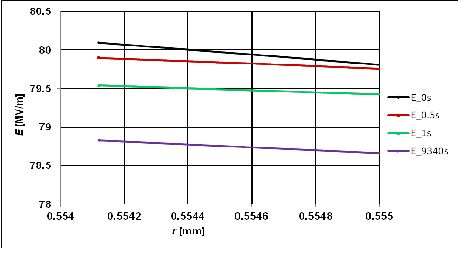
Figure 5. Electric field repartition in the presence of water trees (la = 0,2 mm, electrokinetic cuasistationary regime)
Analyzing the figure 5 it comes out that the maximum values of the electric field E are reached immediately after the voltage switching on. Even after 104seconds the electric field has high values, allowing the continuous processes of degradation and eventually the breakdown of cable insulation in time.
Activity 6. Realization of the ageing state estimation and remaining lifetime Term: 23.07.2012 Responsible: Dr. Ing. Cristina STANCU (INCDIE ICPE CA)
For lifetime estimation the breakdown values of the breakdown voltages Ustr on three groups where water trees were developed at U = 5 kV and frequencies f = 1, 2 and 3 kHz, were determined. The variations of the breakdown voltage Ustr with the ageing time τ are presented in Figure 6.
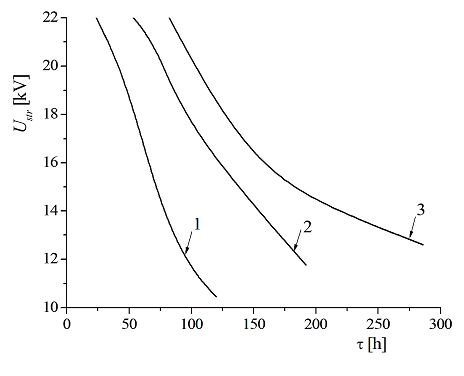
Figure 6. Variation of the breakdown voltage with the ageing time τ pentru f = 3 kHz (1), f = 2 kHz (2), f = 1 kHz (3).
Using the point coordination’s Q’1,2,3, the lifetime line in logarithmic scale was drawn:
y = a + bx,
where x = lgf and y = lgDa and constants a and b have values a = 4.37061 and b = - 0.76348. The lifetime of samples for any frequency is obtained. For example, for f = 50 Hz was obtained D50 = 1174.89 ore (48.95 days).
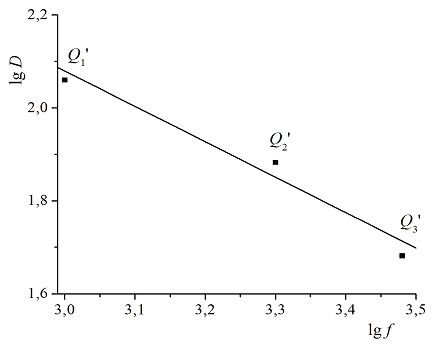
Figure 7. Lifetime line using the Q1’, Q2’, Q3’ lines.